46% of small businesses have no idea if their sales efforts actually work. They’re making calls, sending emails, and attending networking events, but they can’t connect any of it to revenue. They’re tracking activity instead of results, and it’s costing them thousands in wasted effort.
The businesses that grow don’t have this problem. They track specific sales KPIs that predict revenue, identify bottlenecks, and reveal which lead sources actually convert. They use CRM automation to see these metrics in real time, not buried in spreadsheets they update once a quarter.
The difference between tracking the right KPIs and the wrong ones isn’t small. It’s the difference between knowing your cost per customer is $850 (and climbing) versus guessing it’s “probably fine.” It’s the difference between seeing your sales cycle stretched to 90 days (and fixing it) versus wondering why deals keep stalling.
This guide covers the seven sales performance KPIs that separate growing businesses from struggling ones. You’ll learn what each metric reveals, why it matters more than activity metrics, and how sales automation makes tracking effortless instead of painful. These aren’t vanity metrics that make you feel busy. These are the numbers that predict whether you’ll hit your revenue goals or miss them by miles.
What Sales KPIs Do Successful Businesses Actually Monitor Daily?
Revenue Per Lead: The KPI That Shows If Your Marketing Actually Works
Revenue per lead tells you the average dollar value each lead generates for your business. Calculate it by dividing total revenue by total leads generated. If you made $50,000 last quarter from 200 leads, your revenue per lead is $250.
This metric cuts through all the noise about lead volume and traffic numbers. You could generate 1,000 leads and still go broke if they’re worth $5 each. Meanwhile, your competitor generates 100 leads worth $500 each and builds a thriving business.
Revenue per lead reveals which marketing channels actually deliver value. Your Facebook ads might generate 10x more leads than LinkedIn, but if LinkedIn leads close at 3x the average deal size, LinkedIn wins. Most businesses discover that their highest-volume lead sources produce their lowest-quality prospects.
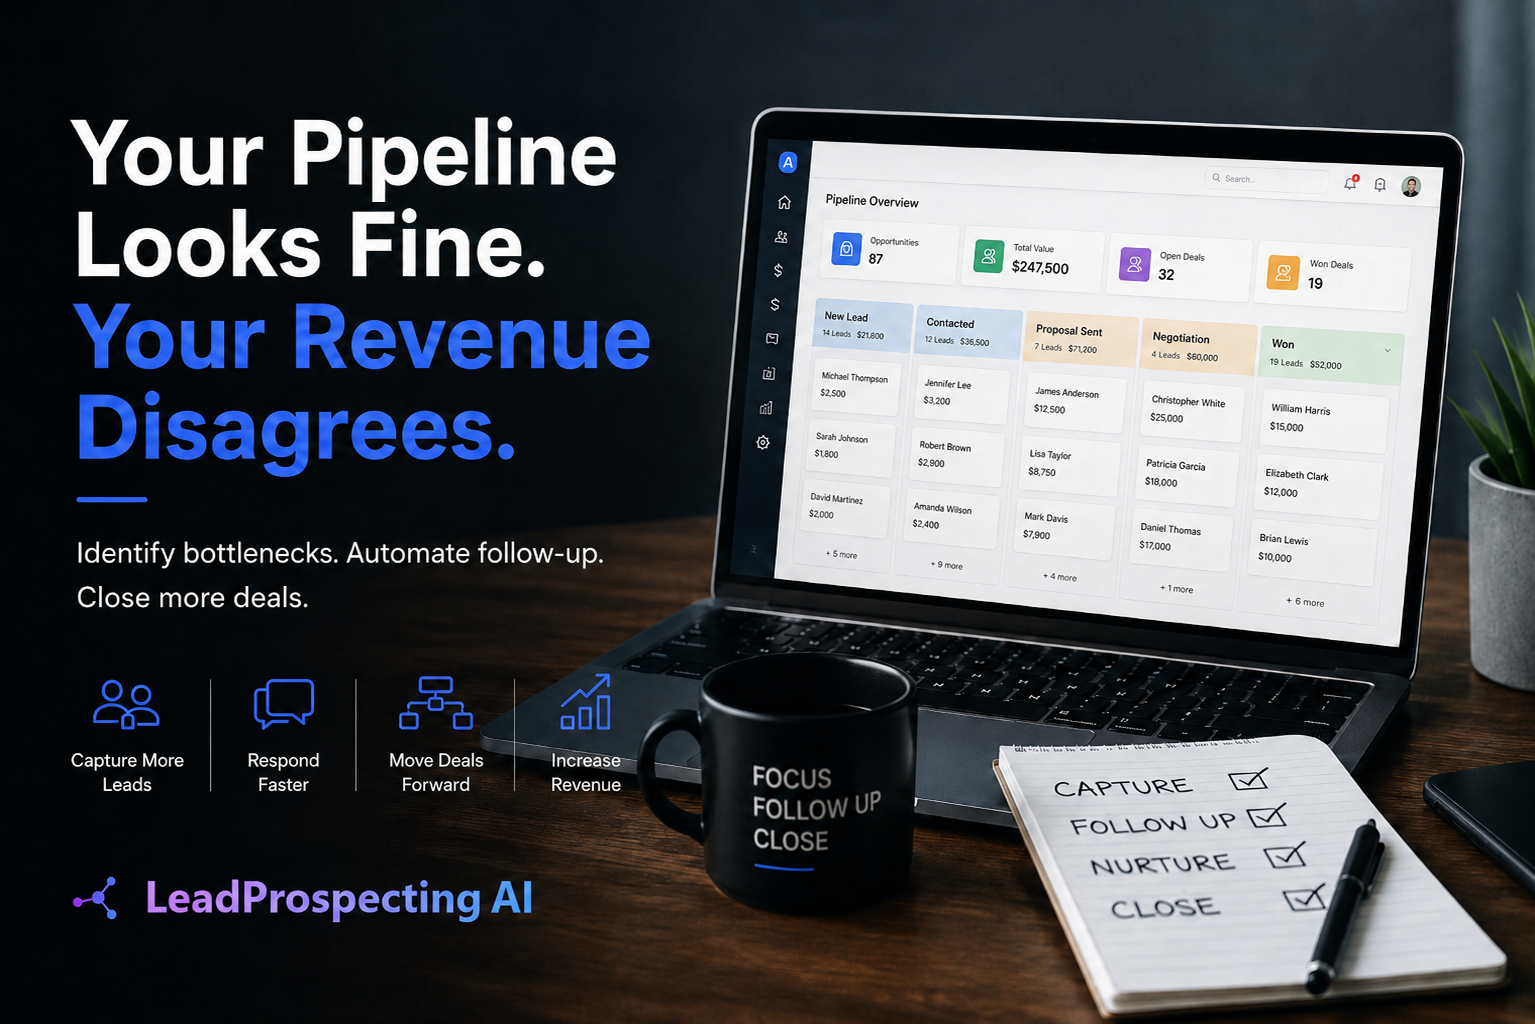
Track revenue per lead by source using CRM software that attributes closed deals back to original lead sources. LeadProspecting AI automatically calculates this metric by connecting lead generation channels to closed revenue. When you see that trade show leads generate $450 each while purchased lead lists generate $85, budget allocation becomes obvious.
Customer Lifetime Value vs. Acquisition Cost: The Ratio That Determines Profitability
Customer lifetime value (CLV) measures total revenue a customer generates over their entire relationship with your business. Customer acquisition cost (CAC) measures what you spend to acquire them. The CLV to CAC ratio determines if your business model actually works.
A healthy CLV to CAC ratio is at least 3:1. If you spend $1,000 to acquire a customer, they need to generate at least $3,000 in lifetime revenue. Anything lower means you’re burning money to grow. Many small businesses discover they’re operating at 1.5:1 or worse, losing money on every customer they acquire.
Calculate CLV by multiplying the average purchase value by purchase frequency and customer lifespan. A customer who spends $500 twice a year for five years has a CLV of $5,000. Calculate CAC by dividing total sales and marketing costs by the new customers acquired. If you spent $10,000 and acquired 20 customers, your CAC is $500.
The businesses that scale profitably obsess over this ratio. They know their CLV and CAC by lead source, by product line, and by sales rep. They use workflow automation to track these metrics continuously, adjusting spending when the moment ratios slip. Without this visibility, you’re flying blind, pouring money into channels that destroy value while starving channels that create it.
How Do You Measure Sales Team Efficiency Without Micromanaging?
Average Time to Close: The KPI That Reveals Process Bottlenecks
Average time to close measures the days between first contact and the closed deal. Add up the sales cycle length for all closed deals and divide by the number of deals. If ten deals took a combined 400 days to close, your average time to close is 40 days.
This metric exposes inefficiency that activity metrics hide. A sales rep might look productive making 50 calls per week, but if their deals take 120 days to close versus the team average of 45 days, something’s broken. Either they’re targeting the wrong prospects, missing critical follow-up steps, or failing to create urgency.
Long sales cycles kill cash flow and limit growth. Every extra week in your sales cycle means less revenue this quarter and fewer resources to invest in growth. The businesses that compress sales cycles without sacrificing close rates scale faster than competitors stuck in 90-day slogs.
Sales automation accelerates time to close by eliminating delays. Automated follow-up sequences keep deals moving when manual follow-up would lag. Automated proposal generation and contract signing remove the “waiting on paperwork” delays that stretch cycles by weeks. LeadProspecting AI tracks time to close by rep, by lead source, and by deal size, revealing exactly where bottlenecks occur.
Using Workflow Automation to Speed Up Your Sales Cycle
Workflow automation eliminates the delays between sales stages that stretch cycles from weeks to months. The moment a lead requests a proposal, automation triggers proposal generation, delivery, and follow-up. No waiting for your rep to remember to send it.
Most sales cycle length comes from delay, not decision-making. Prospects wait three days for a proposal. They wait five days for answers to questions. They wait a week for contract review. Each delay gives them time to reconsider, shop competitors, or lose interest entirely.
Automated workflows compress these gaps to minutes. Lead requests demo, automation sends calendar link, and confirmation. Prospect asks pricing question, automation delivers detailed pricing guide and case studies. Deal reaches contract stage, automation sends agreement and schedules follow-up. The prospect never experiences dead air that breeds doubt.
Build workflows that respond to specific triggers: lead downloads, pricing guide, and receives nurture sequence addressing common objections. Deal reaches 50% probability, automation notifies the manager for strategic support. Proposal sent but not opened in 48 hours, automation triggers phone call task. These if-this-then-that sequences eliminate the manual coordination that stretches sales cycles.
Track workflow performance in your CRM software. Deals that flow through automated sequences should close faster than manually managed deals. If they don’t, your automation needs refinement. The goal isn’t automation for its own sake. The goal is to remove friction that costs you revenue.
Which Lead Conversion Metrics Matter Most for Small Business Growth?
Opportunity-to-Close Rate: Your Team’s True Success Metric
Opportunity-to-close rate measures the percentage of qualified opportunities that become customers. Divide closed deals by total qualified opportunities. If your team closed 15 deals from 50 opportunities last quarter, your opportunity-to-close rate is 30%.
This metric reveals sales execution quality better than any activity measure. A rep making 100 calls with a 15% opportunity-to-close rate is half as effective as a rep making 50 calls with a 30% rate. Volume doesn’t matter if the conversion doesn’t follow.
Track opportunity-to-close rate by lead source to identify which channels deliver prospects most likely to buy. Your webinar registrations might convert at 45% while cold outreach converts at 8%. Both generate opportunities, but one is six times more likely to close. Budget flows to what converts, not what generates activity.
Low opportunity-to-close rates signal specific problems. If rates drop below 20%, you’re either qualifying poorly (calling everyone an opportunity when they’re not) or selling ineffectively (strong prospects aren’t buying). Break down rates by stage to find exactly where deals die. Most businesses discover 60% of lost deals die at a single stage that a better process would fix.
Lead Nurture Performance: Why Long-Term Follow-Up Beats Quick Pitches
Lead nurture performance tracks how well your follow-up system converts leads who aren’t ready to buy immediately. Most leads need 6-8 touchpoints before they’re ready to make a decision, but most businesses give up after two follow-ups.
Calculate nurture performance by comparing close rates between immediately responsive leads and nurtured leads. If hot leads close at 25% and nurtured leads close at 18%, your nurture sequence is performing well. If nurtured leads close at 3%, your nurture system is broken or nonexistent.
Email automation makes consistent nurture possible without constant manual effort. A prospect downloads your pricing guide but doesn’t respond to your call. Automation sends a case study three days later, a comparison guide five days after that, and a customer testimonial video a week later. Each touchpoint maintains a relationship without requiring your team to remember and manually send content.
The businesses that win measure nurture sequence performance by content piece, by send cadence, and by lead source. They discover that prospects from referrals need just three touchpoints while trade show leads need 12. They learn that video testimonials convert 3x better than written case studies. They use this data to refine sequences continuously, improving conversion without increasing effort.
How Can You Use Sales Automation and CRM Software to Track All This Without Drowning in Data?
Building Dashboards That Show What Matters (And Hide What Doesn’t)
Effective dashboards display only the KPIs that drive decisions and hide everything else. Most businesses build dashboards that show 30 metrics, overwhelming users until nobody looks at them. The best dashboards show seven metrics maximum, all directly connected to revenue.
Your daily dashboard should display: pipeline value by stage, opportunity-to-close rate this month versus last month, average time to close trending, revenue per lead by source, CAC trending, next week’s projected closes, and deals stuck longer than average cycle. These seven metrics tell you if you’re on track, where problems exist, and what needs attention.
Build role-specific dashboards so sales reps see their personal metrics, managers see team performance, and owners see business-level trends. A rep doesn’t need to see company-wide CAC, but they do need to see their individual close rate trending. An owner doesn’t need to see every rep’s daily activity, but they do need to see overall pipeline coverage.
Modern CRM automation updates dashboards in real time. The moment a deal closes, your revenue metrics update. The moment a lead converts to an opportunity, your conversion rates recalculate. No waiting until Friday to manually export data, update spreadsheets, and generate reports. The businesses that respond fastest to trends are the ones seeing data in real time.
LeadProspecting Ai provides pre-built dashboards for small businesses that connect lead generation, sales automation, and revenue tracking in one view. You see which marketing campaigns generated leads, how those leads progressed through your pipeline, and which ones closed into revenue. Attribution that used to require expensive analytics platforms now exists in a $39/seat system built specifically for small business needs.
Real-Time KPI Tracking vs. End-of-Month Panic Reporting
Real-time tracking means you see problems the day they start, not three weeks after they’ve cost you thousands. End-of-month reporting tells you what has already happened. Real-time tracking lets you change what will happen.
Your pipeline coverage drops below 3x quota on Tuesday morning. Real-time tracking alerts you immediately so you can adjust focus, accelerate deals, or launch a lead generation campaign. End-of-month reporting shows you missed quota because pipeline was thin, but by then it’s too late to fix.
Sales automation enables real-time tracking without manual data entry. Your CRM software captures every interaction, updates deal stages automatically, and recalculates metrics continuously. No one needs to remember to update opportunity stages or log completed activities. The system records actions as they happen and reflects them in your KPIs immediately.
Set up automated alerts for metrics that matter. Pipeline coverage drops below the target, and you get notified. A high-value deal hasn’t advanced in 14 days, and your rep gets alerted. Average time to close increases 20% over the rolling average, and management gets flagged. These alerts turn passive reporting into active management, catching problems while they’re still fixable.
The businesses that scale profitably don’t discover problems in quarterly reviews. They see them in daily dashboards and fix them before they compound. They use data automation to eliminate the manual work of tracking while increasing the quality and timeliness of insights. They operate with visibility that used to require analytics teams, but they do it through workflow automation built for small business scale.
Bottom Line
Tracking the right sales KPIs transforms your business from guessing about performance to knowing exactly what drives revenue. Revenue per lead shows which marketing channels actually work. CLV to CAC ratio reveals if your business model is profitable. Average time to close exposes process inefficiencies. Opportunity-to-close rate measures execution quality. These metrics, tracked in real time through CRM automation, give you the visibility to make decisions before problems become crises. The businesses that grow aren’t smarter or luckier. They simply measure what matters and adjust based on what they see.
FAQ
What are the most important sales KPIs for small businesses to track?
The most important sales KPIs are revenue per lead (shows marketing effectiveness), customer acquisition cost (reveals spending efficiency), customer lifetime value to CAC ratio (determines profitability), opportunity-to-close rate (measures sales effectiveness), and average time to close (exposes process bottlenecks). These five metrics predict growth better than activity metrics like calls made or emails sent.
How do you calculate customer lifetime value?
Calculate customer lifetime value by multiplying average purchase value by purchase frequency and customer lifespan. If a customer spends $500 per purchase, buys twice per year, and stays for five years, their CLV is $5,000. Track this by customer segment and lead source to identify your most valuable customers.
What is a good opportunity-to-close rate?
A good opportunity-to-close rate varies by industry, but 20-30% is typical for B2B small businesses. Rates below 15% suggest poor qualification or weak sales execution. Rates above 40% might indicate you’re only pursuing slam-dunk deals and missing growth opportunities. Track your rate by lead source to identify which channels produce prospects most likely to buy.
How can sales automation help track KPIs more effectively?
Sales automation tracks KPIs automatically by recording every lead interaction, updating deal stages in real time, and calculating metrics continuously without manual data entry. CRM software displays these metrics in live dashboards so you see problems the day they start rather than weeks later in manual reports. Automation eliminates the administrative work of tracking while improving data accuracy.
What is pipeline coverage, and why does it matter?
Pipeline coverage is the ratio of your total pipeline value to your revenue quota. A 3:1 ratio means you have three dollars of pipeline for every dollar of quota. This metric predicts if you’ll hit revenue targets. Coverage below 2:1 means you’ll likely miss quota unless close rates improve dramatically. Sales teams monitor this weekly to ensure they’re generating enough opportunities.
How long should your sales cycle be?
Sales cycle length varies by industry and deal size, but most small B2B businesses should target 30-60 days from first contact to closed deal. Cycles longer than 90 days signal process inefficiency or poor prospect qualification. Track your average time to close and work to reduce it by 10-20% through workflow automation and better qualification.
What sales KPIs should sales managers track daily?
Sales managers should track pipeline value by stage, deals closing this week, opportunity-to-close rate trending, average time to close compared to team average, and stalled deals exceeding average cycle length. These five daily metrics reveal team performance, forecast accuracy, and where coaching is needed.
How do you improve your customer acquisition cost?
Improve customer acquisition cost by focusing marketing spend on channels with the best revenue per lead, increasing close rates through better lead qualification and sales process, reducing sales cycle length through automation, and improving customer lifetime value so each customer justifies higher acquisition spending. Track CAC by channel to identify waste.
What is the difference between a lead and an opportunity in sales KPIs?
A lead is any contact who has expressed interest but hasn’t been qualified. An opportunity is a qualified prospect with defined need, budget, authority, and timeline. Your lead-to-opportunity conversion rate shows qualification effectiveness. Your opportunity-to-close rate shows sales effectiveness. Most businesses confuse the two, making their conversion metrics meaningless.
Why is real-time KPI tracking better than monthly reporting?
Real-time KPI tracking lets you fix problems before they compound into missed quotas and lost revenue. You see pipeline coverage dropping and can launch campaigns immediately. Monthly reporting tells you what already happened when it’s too late to change outcomes. CRM automation enables real-time tracking without manual work, giving you visibility that used to require full-time analysts.
If your business relies on service calls, FieldServ Ai applies these same KPI and automation principles to the phone itself. It captures missed calls, schedules jobs automatically, and tracks which calls turn into booked revenue, so your CRM shows not just leads, but real service demand in real time. It’s the simplest way to stop losing jobs after hours without adding staff.